Request No
Arab World Information
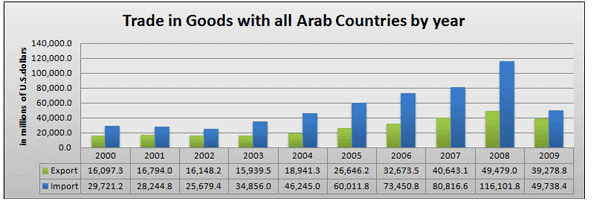
Trade in Goods with Arab Countries
NOTE: All figures are in millions of U.S. dollars, and not seasonally adjusted unless otherwise specified.
| Year | Export | Import | Trade Balance |
|---|---|---|---|
| 2000 | 16,097.3 | 29,721.2 | -13,623.9 |
| 2001 | 16,794.0 | 28,244.8 | -11,450.8 |
| 2002 | 16,148.2 | 25,679.4 | -9,531.2 |
| 2003 | 15,939.5 | 34,856.0 | -18,916.5 |
| 2004 | 18,941.3 | 46,245.0 | -27,303.7 |
| 2005 | 26,646.2 | 60,011.8 | -33,365.6 |
| 2006 | 32,673.5 | 73,450.8 | -40,777.3 |
| 2007 | 40,643.1 | 80,816.6 | -40,173.5 |
| 2008 | 49,479.0 | 116,101.8 | -66,622.8 |
| 2009 | 39,278.8 | 49,738.4 | -10,459.6 |
| Totals | 272,640.9 | 544,865.8 | -272,224.9 |
| Country | Export | Import | Trade Balance |
|---|---|---|---|
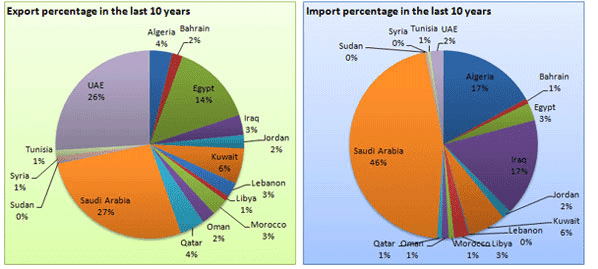
| Algeria | 10,478.0 | 92,375.8 | -81,897.8 |
| Bahrain | 4,978.5 | 4,588.9 | 389.6 |
| Egypt | 38,839.4 | 16,677.3 | 22,162.1 |
| Iraq | 9,425.8 | 91,045.1 | -81,619.3 |
| Jordan | 6,283.2 | 8,502.8 | -2,219.6 |
| Kuwait | 16,688.6 | 34,869.9 | -18,181.3 |
| Lebanon | 6,880.3 | 845.2 | 6,035.1 |
| Libya | 2,394.7 | 13,726.1 | -11,331.4 |
| Morocco | 7,843.6 | 5,049.9 | 2,793.7 |
| Oman | 6,357.7 | 6,442.7 | -85.0 |
| Qatar | 11,538.0 | 4,320.2 | 7,217.8 |
| Saudi Arabia | 73,856.2 | 249,077.9 | -175,221.7 |
| Sudan | 621.5 | 54.9 | 566.6 |
| Syria | 2,596.9 | 2,268.9 | 328.0 |
| Tunisia | 3,140.3 | 2,761.7 | 378.6 |
| UAE | 70,718.2 | 12,258.5 | 58,459.7 |
| Totals | 272,640.9 | 544,865.8 | -272,224.9 |
* Data collected from: U.S. Census Bureau, Foreign Trade Division, Data Dissemination Branch, Washington, D.C. 20233.
Mailing and Contact Information
US Arab Chamber of Commerce
1330 New Hampshire Ave,
NW Suite B1,
Washington, D.C. 20036
Tel: (202) 347 - 5800
Fax: 
email:
Copyright © US Arab Chamber of Commerce “USACC”. 1984 - 2017. All Rights Reserved.